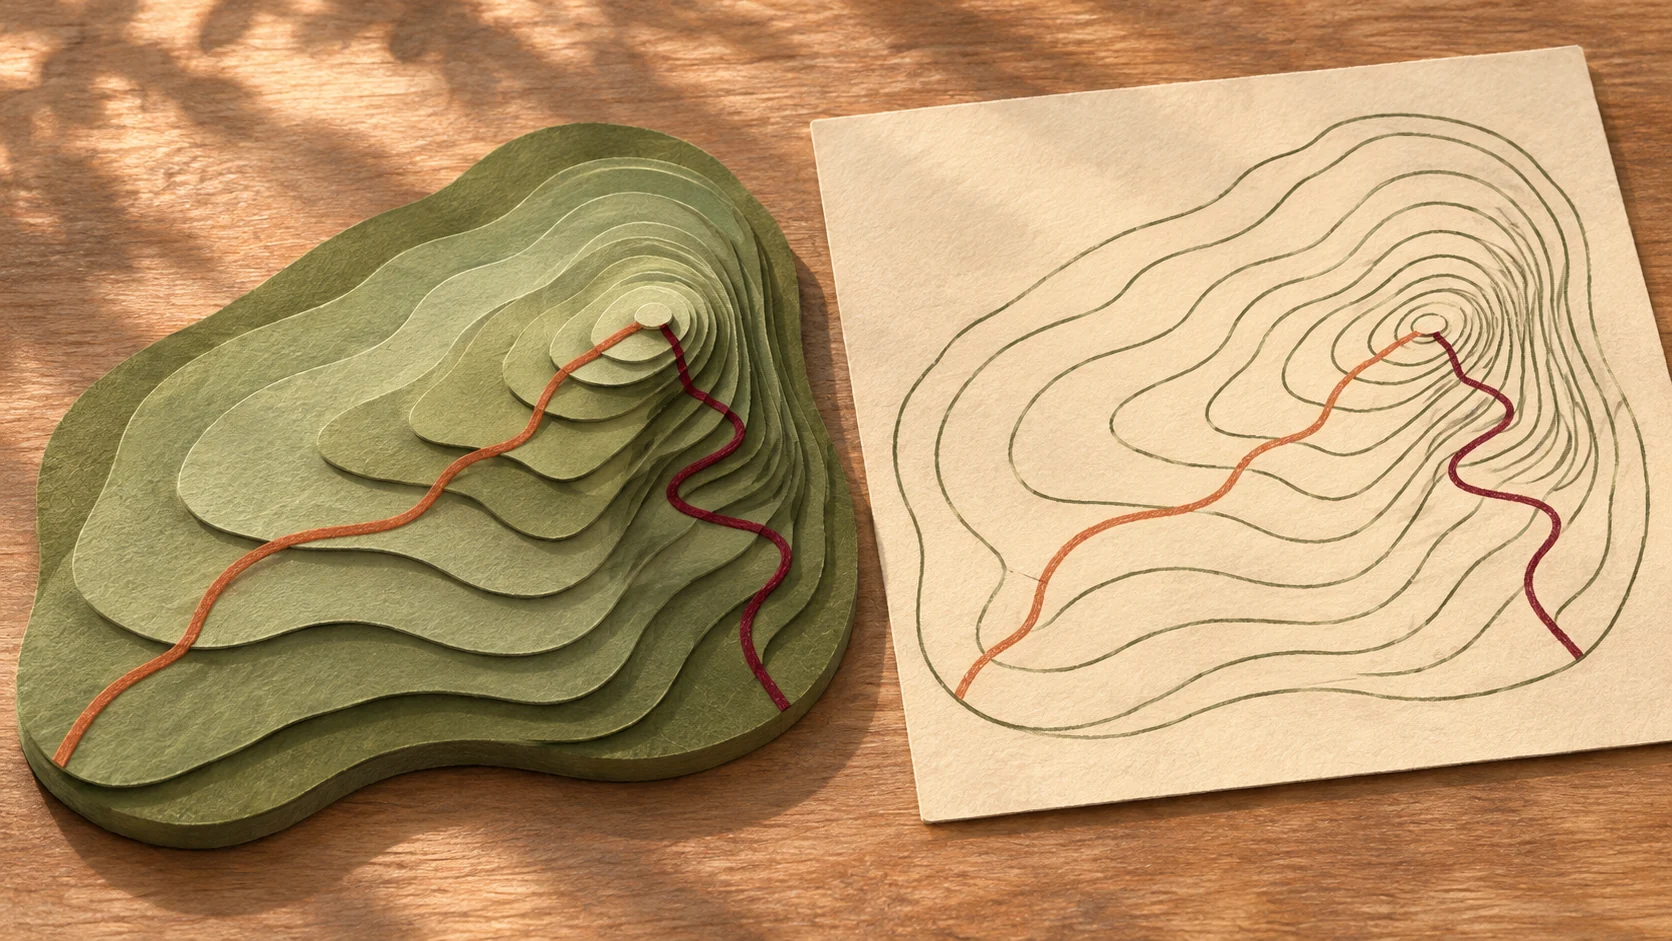
Suppose two trails start from the same foot of a mountain and both lead to a viewpoint. Trail A looks shorter on the map, while Trail B takes a detour. A friend says Trail A must be the easier one. But you notice that where Trail A passes, the contour lines are almost crowded together.
On a map, route length and slope are two different pieces of information. To explain how these two routes differ, you first need to learn what a map actually draws. The Grade 7, Volume 1 geography course offers a set of methods for finding evidence on a map.
First, work out what the map in your hands can answer
In Lesson 2, students first encounter the globe and the graticule, then learn to read maps using scale, direction and legend. The graticule can indicate a place's position on Earth. To judge which way the junction at the foot of the mountain faces, or how far apart two points on the map are, you need to read the direction marker and scale of the map in your hands. With a scale of 1:10,000, 1 centimeter on the map equals 100 meters on the ground. A winding road can be estimated by breaking it into several short segments. Lesson 2, "The Foundations of Our Earthly Home: Graticule and Map Applications"
The legend also matters for judgment. Similar lines may represent footpaths, rivers or administrative boundaries respectively. First identify what a line means, then follow it to the next junction.
How a hillside is kept on a flat sheet of paper
A single contour line connects points at the same elevation. On the same map with a fixed contour interval, the closer together adjacent lines are, the shorter the horizontal distance over which the same change in height occurs—and the steeper the slope. When looking at an uphill route, you can observe along your direction of travel how far apart adjacent contour lines are, then compare which section concentrates the climbing.
You can practice with just paper and a pen. Draw four contour rings of different sizes, rising gradually from the outside inward, with the spacing tight on the left and loose on the right. Then draw a route to the top from each side. Both routes reach the same height, but the spacing of the lines on the map will tell you where each one distributes the climb.
Bring the same map-reading method to larger places
Lesson 3 shifts the view from a single mountain to continents, oceans and plates. You can first locate plate boundaries on a map, then see how the course uses divergence and compression to explain changes in land and sea. Lesson 4 switches to two other kinds of maps. Weather symbols help people understand weather conditions over a short period, while temperature and precipitation distribution maps let people compare climate characteristics over a longer period. Both maps appear to describe a place, but when reading them you must first distinguish the timescale each one uses. Lesson 3, "Changes in Land and Sea" · Lesson 4, "Evolution of the Atmosphere"
From terrain to how people live there
The introduction uses the Yuanyang rice terraces to discuss the relationship between people and the environment. When looking at a photo of terraced fields, you can follow the slope from high ground to low ground, locating forests, villages and fields, and ask how water is channeled down the terrain into the fields. Lesson 5 extends this kind of observation to settlements. Villages that stretch along a river and villages that spread out in all directions on open flat land leave different spatial clues. Lesson 1, "Opening the Window on Geography" · Lesson 5, "Human Geography"
This Simplified Chinese course suits Grade 7 students for preview or review, and can also serve as an entry point for parents reading maps with their children. Turn to Lesson 2 and first try pointing out to someone the stretch where the contour lines are densest, then explain what it has to do with the slope you meet on the way up. Enter the GEOG701A-PEP-CN course